Friends familiar with the underlying mechanisms of Bitcoin are aware that on the Bitcoin blockchain ledger, it’s not individual bitcoins that are tracked, but rather individual Unspent Transaction Outputs (UTXOs). This technical term is referred to as “Unspent Transaction Output.” Some refer to these as “Bitcoin coins” or BTC coins.
Currently, there are approximately 130 million BTC coins recorded on the Bitcoin ledger.
An intriguing question is: How is the purchase price of these coins distributed? A research study from Glassnode provides some insights.
First and foremost, it’s important to note that we cannot accurately determine the true purchase price of each UTXO. This is because a significant portion of UTXOs are traded on centralized exchanges, and obtaining transaction price data is quite challenging. One approach is to calculate the so-called “Realized Price,” which is based on the market price of BTC at the time the UTXO was generated. While this is not an exact transaction price, it does offer a certain perspective. By using this price to estimate the acquisition cost of all UTXOs and then plotting a distribution graph, the following figure is obtained.
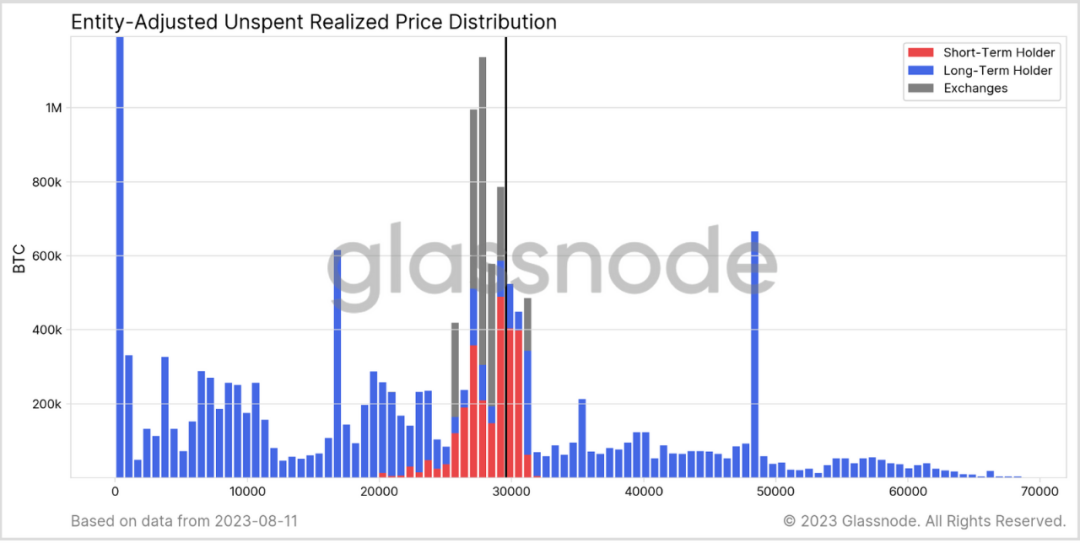
The horizontal axis represents price, and the vertical axis represents coin balance (units: BTC). The blue indicates long-term holders, the red represents short-term holders, and the gray represents centralized exchanges.
From this graph, it’s quite evident that these coins can be divided into three ranges:
Below $15,000: These UTXOs appear to have been dormant for a significant period. We know that once coins are moved, old coins are “destroyed” and new coins are “created.” Since BTC has not dipped below $15,000 since the previous cycle in 2020, these precious coins must have been generated before 2020. Those who firmly hold onto these coins are likely seasoned HODLers who have weathered market cycles.
Based on historical data of this group’s behavior, they often cash out after BTC breaks its previous all-time high (ATH). So, if BTC is to surpass the previous high of $69,000, it could trigger the sale of these coins.
$15,000 to $30,000: Within this range, there are both long-term holders and short-term traders. The current Bitcoin price is hovering around the upper boundary of this range.
Long-term investors who continue to accumulate during this market cycle will persist with regular investments and buy the dips within this range, making them the strongest support during this bear market.
Similarly, this range is populated by traders lacking long-term conviction, engaging only in short-term profit-driven transactions.
As has been said, the former boosts the market floor, while the latter creates volatility.
Above $30,000: These are the bargain hunters who joined the market during the high points of the 2021 bull run. Among them are those who strategically positioned themselves for long-term investments, but there’s also a significant portion caught in speculative positions, reluctant to sell at a loss. Such positions can easily become resistance as Bitcoin moves from $30,000 to its previous high of $69,000. Their mindset often leans towards: “Hooray, after X years, I’ve finally broken even, let’s take profits and run!”
As they say, there are three rules for the novices: buy high, cut losses at the bottom, and sell once you’ve broken even.
However, once the market surpasses this resistance range and breaks the previous high, it opens up an upward trajectory.
Comments