Yesterday, Bitcoin staged a fake breakout above its 30-day moving average (around $83.5k), and today it dove straight back down to the vicinity of its 50-day moving average (around $81.8k). While browsing online, I came across a chart plotting US midterm elections against Bitcoin’s price history [1]. The chart lays out BTC’s price curve, marks the midterm election years, and points an arrow at the election month each time: November 2014, November 2018, November 2022. Nearly all of them land near the bottom of a cycle. This year’s election falls on November 3 [1].
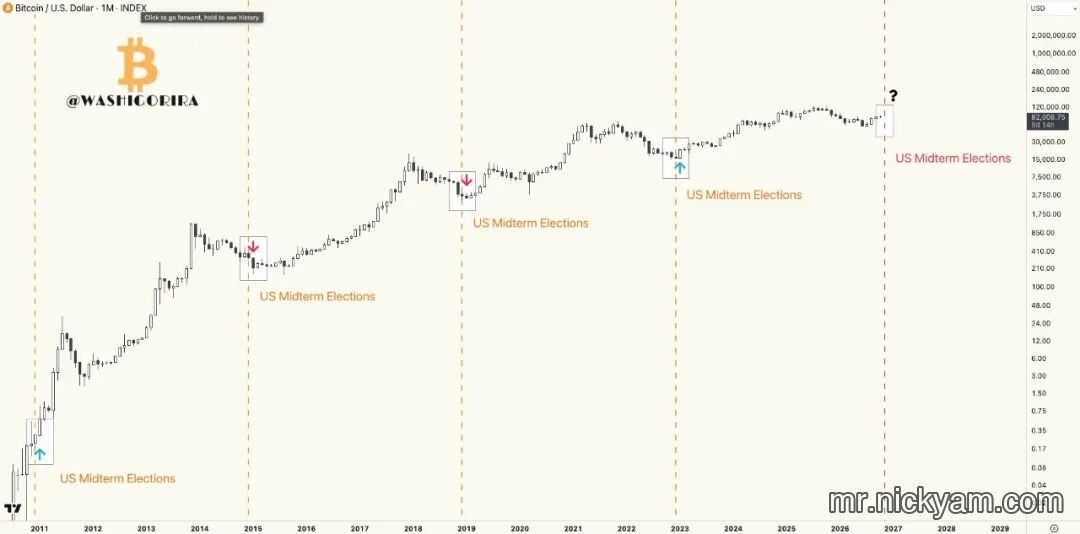
The pattern is striking. It seems to hit every single time, and anyone looking at it would let their imagination run wild. But think one level deeper: why is the timing so conveniently perfect?
As everyone knows, Bitcoin’s supply halves once every four years: November 2012, July 2016, May 2020, April 2024 — each interval four years apart [2]. US midterm elections also come every four years, falling in the second year of a presidential term [1]. Two cycles of identical length naturally collide on the calendar.
The election month lands roughly two to two and a half years after a halving. November 2014 came two years after the November 2012 halving; November 2018 came two years and four months after July 2016; November 2022 came two and a half years after May 2020; and this November comes about two years and seven months after April 2024. Bitcoin’s cycle lows, in turn, typically show up in that same window of two to two and a half years after a halving [2]. Line up the two calendars, and the lows inevitably land on election months.
There is no causal relationship here — not even a stable statistical correlation. It is mere synchronicity. Midterm elections do not determine Bitcoin’s bottoms; they simply share a calendar with them.
Now look at the sample size. Each of the past three lows had a different cause. In 2014, it was the long unwind after the Mt. Gox collapse, with the price grinding down from over a thousand dollars to around two hundred [3]. In 2018, it was the BCH fork war layered onto the tail end of a bear market, with the price falling from $19,000 to $3,200 [3]. In 2022, it was the FTX meltdown, from $69k down to $16k [3]. Different events, similar timing. What was at work was not the elections but the cycle itself.
That said, there may be some faint, indirect connections running underneath. The second year of a US presidential cycle is typically weak for risk assets — a seasonality American markets have studied for decades — and Bitcoin’s correlation with US equities has been rising in recent years, so it inherits some of that temperament. The idea that midterm election years tend to be under pressure does sound plausible. But it is a second-order effect, not the main driver.
Only time can truly test this chart. If the bottom does indeed land around November again, the chart will keep getting cited, and people will be reposting it next year. If the bottom already appeared back in the summer, then this chart is nothing more than survivorship bias selected in hindsight — you see it only because the charts that failed no longer appear in front of you.
Charts that mistake coincidence for law are everywhere. Two cycles of the same length are always going to look alike. Causal claims should rest on mechanisms, not shapes. A shape can be contorted to fit a story; a mechanism does not bend to anyone’s will.
References
- [1] US midterm elections recur every four years in the second year of a presidential term; the election months discussed are November 2014, November 2018, and November 2022, with the next election falling on November 3, 2026.
- [2] Bitcoin halving dates cited: November 2012, July 2016, May 2020, and April 2024 — each roughly four years apart, with cycle lows historically clustering two to two and a half years after each halving.
- [3] Historical cycle-low episodes referenced: the post-Mt. Gox unwind of 2014–2015 (from above $1,000 to around $200), the 2018 bear market ending amid the BCH fork war (from $19,000 to $3,200), and the 2022 FTX collapse (from $69,000 to $16,000).