Eighty-two thousand dollars — that is the level Bitcoin spent the entire week probing, without ever really leaving. On Monday, U.S. spot Bitcoin ETFs took in $527 million of net inflows, their best day since September 22, with BlackRock’s IBIT alone absorbing $665 million and trimming October’s net outflow to roughly $88 million [1]. Money is flowing back; the price is standing still.
That same day, JPMorgan Asset Management published its 2027 Long-Term Capital Market Assumptions (LTCMA). This is the 31st edition of the annual report — and the first in its history to put Bitcoin in it [2].
The long-term forecast it assigns is a 10% compound annual return for BTC over the next 10 to 15 years. Within the report, the number sits at the top of the table: U.S. large-cap stocks at 7.5%, gold at 5.5%, the classic 60/40 stock-bond portfolio at 7%. Starting from the $83,000 reference price the report adopts, 10% annualized implies roughly $215,000 ten years out; the bull case, at 16.6% annualized, implies about $385,000; the bear case, at an annualized loss of 11.2%, implies about $25,000 [3].
Written In, But Not Fully Accepted
The report did not, however, put BTC into its main covariance matrix. It explains that this is the first time a range has been put on Bitcoin’s returns, but Bitcoin is not yet included in the main covariance matrices — the stated reasons are excessively high volatility and unstable correlations. In its place stands a smaller, standalone matrix that compares Bitcoin against only a subset of assets [3].
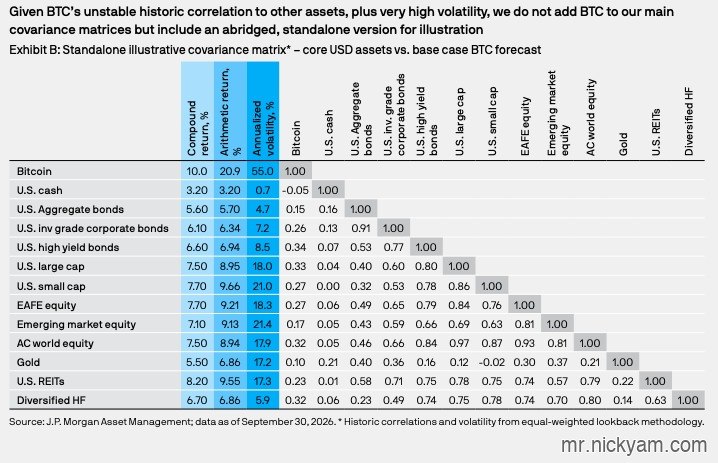
The report’s measured compound annual growth rate (CAGR) for Bitcoin is 10%; its arithmetic average is 20.9%. The gap between the two numbers matters enormously. Suppose an asset rises 100% in year one and falls 50% in year two. Add the two moves, divide by two, and the arithmetic average is 25%. But an investor’s money has not grown at all: one dollar became two, then fell back to one. The compound annual return is zero. The arithmetic mean measures the average of yearly moves; the compound rate measures what actually remains in the account. The higher the volatility, the wider the gap between the two. JPMorgan assigns Bitcoin 55% annualized volatility, against roughly 18% for U.S. large caps and about 17% for gold — which is why its arithmetic average and compound average differ by more than half. The 20.9% figure describes what would happen if you captured the average gain every year; the 10% describes what ten years actually leaves in the account [3].
The skeleton of the forecast is not complicated. Sixty-five percent of the weight goes to a comparison of Bitcoin’s supply growth against the expansion of the dollar and global money supply; 30% goes to its contest for gold’s allocation share — the store-of-value competition we examined when asking why Bitcoin’s fixed supply is a feature, not a flaw; only 5% is left for network adoption, and in the base case this component contributes negative 3.2% a year [4]. The money-supply model and the gold-allocation model each compute a 10.7% annual return, which says that in JPMorgan’s framework Bitcoin’s long-term value comes mainly from monetary conditions and its competition with traditional stores of value — not from the expansion of on-chain applications themselves.
Along the way, the report also dismisses a popular bull narrative: that currency debasement will force money into crypto assets. The report calls that idea “wide of the mark” — meaning, not even close. In its view, Bitcoin’s volatility and unstable correlations make that transmission path unreliable. It even supplies two correlation coefficients: 0.33 against U.S. large-cap equities, 0.10 against gold — neither remotely sufficient for Bitcoin to serve as a stable diversifier in an asset allocation [3].
The Real Meaning of the Report
The real significance of this report does not lie in that 10%.
In the language system of asset allocation, having an asset written into the long-term capital market assumptions means it has moved from off the balance sheet onto it. For the past decade or more, Wall Street’s treatment of Bitcoin amounted roughly to: do not price it, only comment from the sidelines. Now an institution managing trillions of dollars has reserved a place for it in its core forecasting document — a number that can be cited, compared, and dropped into model discussions. This is acknowledgment, but not yet acceptance. Acknowledgment only requires writing a line; acceptance requires entering the main covariance matrix, entering the weights table of strategic allocation, entering the places that actually decide where capital flows.
Between the two stand three thresholds, which the report itself lists: volatility, correlation, liquidity. None of these is a question of values; all are questions of market maturity. Volatility falls as the holder base matures; correlations stabilize as pricing mechanisms converge; liquidity deepens as market-making and custody infrastructure improve. The thresholds standing there means the destination has not been reached — but thresholds can be lowered, and sooner or later they will be.
Read the 10% Coldly
Back to that 10% CAGR: the number deserves a cold eye. The LTCMA is a ten-year-scale assumption, not a forecast for any single year. Under 55% annualized volatility, any individual year will land far away from 10% — up 60% one year, down 40% the next, and only the ten-year average approaches the figure. Reading it as an endorsement from a major bank, or as a price promise, is a misreading.
Matt Hougan, Bitwise’s chief investment officer, put a twist on Gandhi on X: “First they ignore you, then they laugh at you, then they fight you, then they add you to their Long-Term Capital Market Assumptions paper and predict you’ll be the best-performing asset of the next decade” [2]. The line spread quickly through the crypto circle, because it gave words to a feeling many had waited a long time to have.
Finally, a view from inside the crypto world itself: if things unfold as JPMorgan imagines, Bitcoin will have “degraded” into a stable, “low-return,” mature asset — not so different from just digital gold. That may well disappoint the crowd that poured into crypto markets chasing high risk and higher returns.
References
- [1] ChainReport — US Spot Bitcoin ETF Net Inflows Hit $526.7M on Oct 19: Monday’s $526.7M net inflow was the largest since September 22 ($714.7M); BlackRock’s IBIT took in $665.2M while Fidelity’s FBTC (−$83.6M) and Grayscale’s GBTC (−$54.9M) saw outflows, cutting October’s deficit to about $88M. https://chainreport.co/us-spot-bitcoin-etf-net-inflows-hit-5267m-on-oct-19
- [2] Yahoo Finance — JPMorgan Puts a Number on Bitcoin for the First Time: 10% a Year, With a Big Caveat: the 31st annual edition and the first to include Bitcoin; the “wide of the mark” dismissal of the debasement narrative; Matt Hougan’s Gandhi-adapted post on X. https://finance.yahoo.com/markets/crypto/articles/jpmorgan-puts-number-bitcoin-first-211604940.html
- [3] Markets Insider — JPMorgan Predicts Bitcoin Will Beat U.S. Stocks with 10% Annual Returns, Yet Keeps BTC Out of Core Portfolios: base 10.0% / bull 16.6% / bear −11.2% annualized; 55.0% volatility vs 18.0% large caps and 17.2% gold; the 20.9% arithmetic average; exclusion from the main covariance matrices and the standalone smaller matrix; correlations of 0.33 (U.S. large cap) and 0.10 (gold). https://markets.businessinsider.com/news/stocks/jpmorgan-predicts-bitcoin-will-beat-u-s-stocks-with-10-annual-returns-yet-keeps-btc-out-of-core-portfolios-1036645339
- [4] Yahoo Finance — JPMorgan Asset Management Sets a 10% Base Case for Bitcoin, Still Sees No Clear Portfolio Role: the three-model blend weighted 65% (supply vs. money supply) / 30% (gold complement) / 5% (network usage, base case −3.2%); section authors Sheena Shah and Dennis Cristallo; “a speculative asset and a hedge against monetary easing.” https://finance.yahoo.com/markets/crypto/articles/jpmorgan-asset-management-sets-10-090018413.html